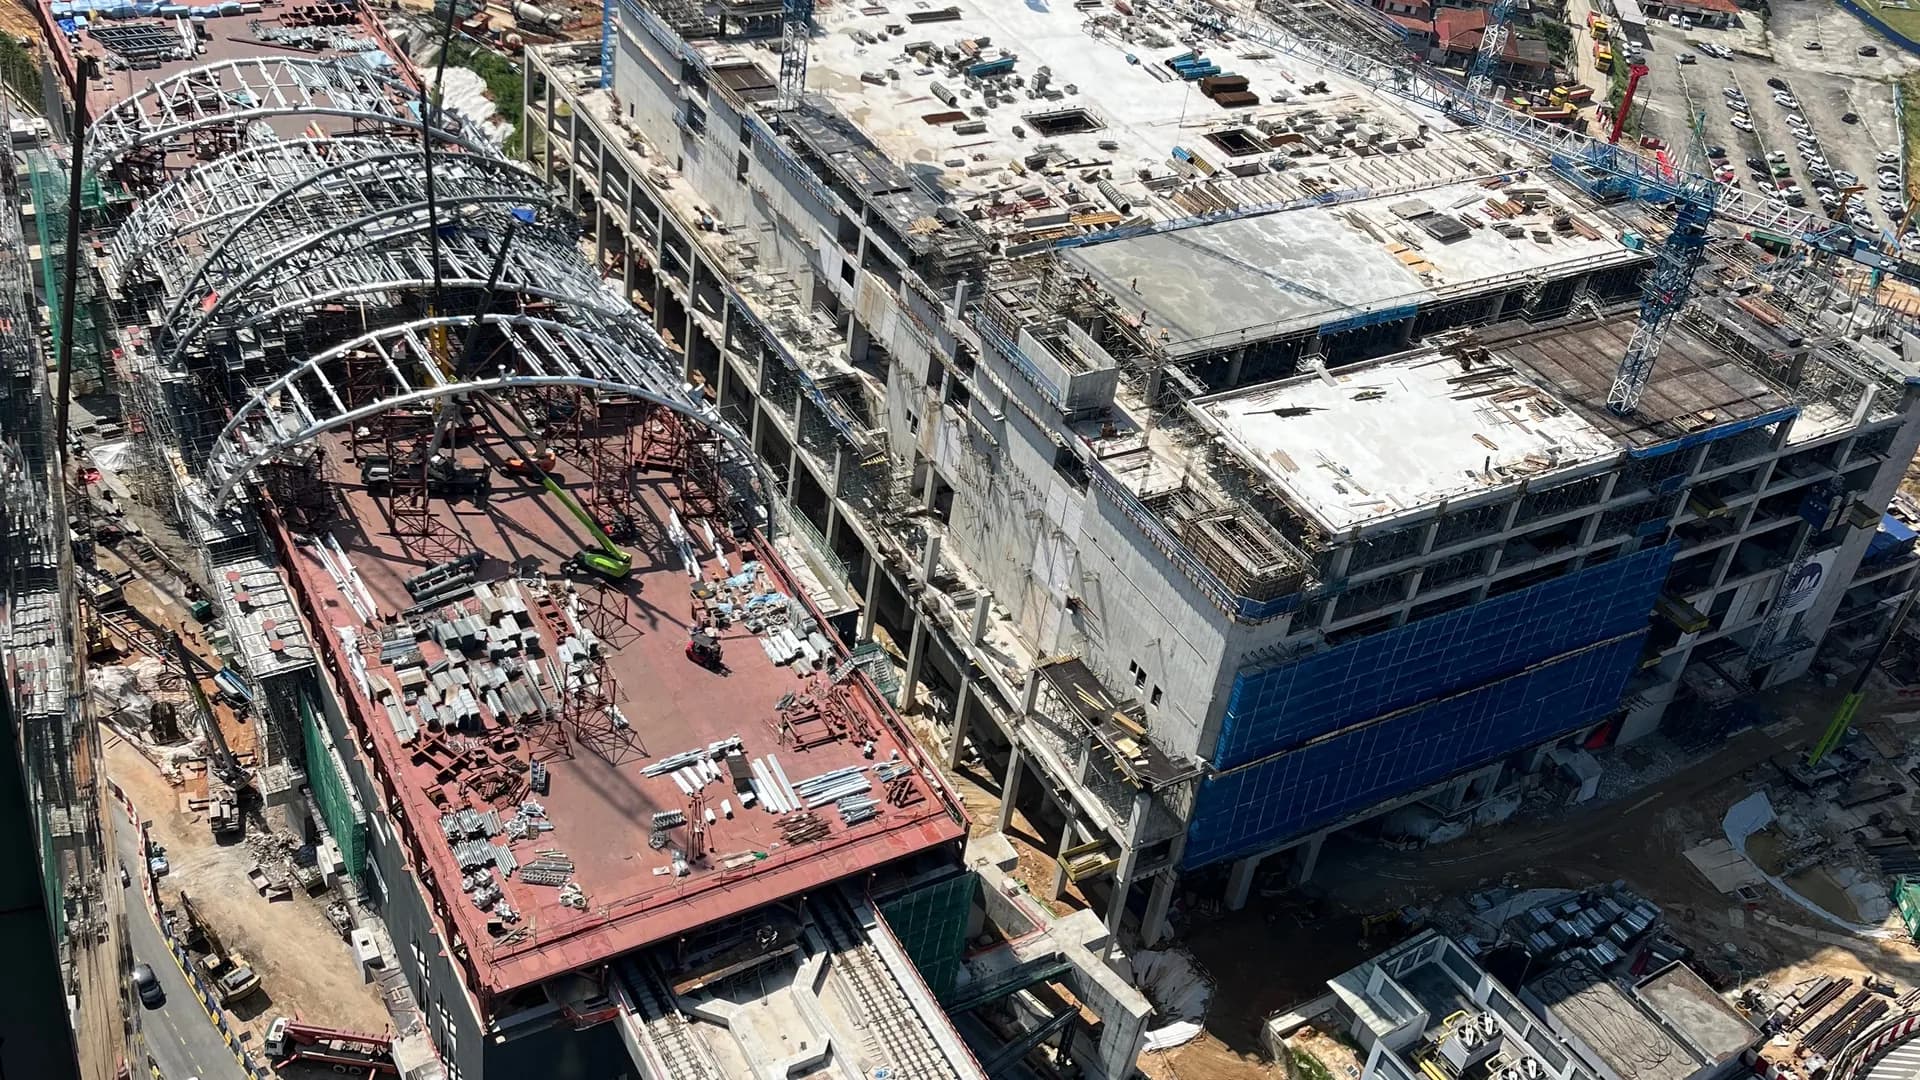
Sunway Big Box lifted on-time collection from 81% to 95%.
A 500,000 sq ft retail complex ran its refuse chambers on paper chits and phone calls. Now every pickup is matched against the schedule it was promised on — and every load is proven with the disposal record attached.


Sunway Big Box Mall
Sunway Big Box Mall and Citrine Hub hold over 500,000 sq ft of prime retail space in Johor — a major shopping destination with diverse tenants and heavy daily foot traffic.
Four separate refuse chambers handled waste from dozens of retail outlets, restaurants, and service providers. The mall needed one clear view of all of it, and a way to recycle that it did not yet have.
- IndustryRetail & Mall
- LocationJohor
- Scale500,000+ sq ft · 5 refuse chambers · Johor operations
- Timeline4 weeks
- UsingMulti-location management, GarGeon Connect, Multi-Chamber Tracking, Recycling Programme Integration, Real-time Performance Reports
The problem, and what we did about it.
Multiple vendors
Several haulers had to be managed at once, which created inefficiency and made nothing run as one operation.
No visibility into the chambers
Each of the four refuse chambers ran blind. No data was captured or tracked, so management could not see what was actually happening.
Manual, paper-based process
Collection ran on paper chits and phone calls. Coordination was slow and easy to lose track of.
No recycling support
The existing vendors offered no recycling at all. The result was a 0% recycling rate.
Everything under one vendor and one contract
We consolidated every service under GarGeon, so the mall stopped juggling multiple haulers.
GarGeon Connect across all five chambers
Waste volume, tonnage, and activity are logged for each refuse chamber — the four general-waste chambers plus the recycling chamber. Management now sees every load on one dashboard.
Digitalised operations
Collection tracking, service proof, and reporting are automated — replacing the paper chits and phone calls.
A recycling programme built into the service
We set up source separation and recycling to keep recyclable items out of landfill, starting from zero.
What changed on the ground.
On-time collection from 81% to 95%
Schedule adherence climbed every month through the quarter as fixed-schedule pickups replaced ad-hoc exchange trips.
Recycling started from nothing and reached 15%
The mall recycled none of its waste before GarGeon. By 2024 the rate had reached 15%. It has since fallen back — the Q2 2026 report puts it at 4.6% — and lifting it again is the current focus.
8% cost savings
Tighter scheduling and a single vendor cut the cost of running waste across the complex.
Full transparency
Real-time data and reports cover tonnage, collection, and recycling across all five refuse chambers.
Fewer calls, fewer surprises
Communication is simpler and service is more reliable now that everything runs on one system.
Sunway Big Box gets a full report every quarter — tonnage, schedule adherence, and recycling, chamber by chamber. Recycling reached 15% in 2024 and has since slipped to 4.6%. The Q2 2026 report said so plainly and recommended what to check: whether cardboard is going into the general chambers, and whether a vendor change reduced pickups. Getting the rate back up is the work in hand.
This is the report Sunway Big Box gets every quarter.
Their actual Q2 2026 numbers, published with their permission: the carbon footprint of their waste, what went to landfill, the recycling rate, and whether pickups arrived on time. One is moving the right way. Three are not — and the report says so rather than leaving it for someone to notice later.
40.02 t to landfill × 0.5206 + 1.31 t recycled × 0.0047 = 20.8 tCO2e in June.
View the chart data as a table
| Measure | April | May | June |
|---|---|---|---|
| Sent to landfill (t) | 33.50 | 37.99 | 40.02 |
| Recycled (t) | 2.40 | 1.62 | 1.31 |
| Recycling rate | 6.7% | 4.1% | 3.2% |
| Waste carbon footprint (tCO2e, est.) | 17.5 | 19.8 | 20.8 |
| Kept off by recycling (tCO2e, est.) | 1.2 | 0.8 | 0.7 |
| On-time collection | 81% | 93.2% | 95.3% |
Carbon figures are estimates: Scope 3, Category 5 under the GHG Protocol, using the UK Government GHG Conversion Factors for Company Reporting (2026 edition) — 0.5206 tCO2e per tonne of commercial waste landfilled and 0.0047 per tonne recycled. If your auditor prefers another factor, the tonnage is the same and the sum still checks.
Tonnage, recycling and on-time figures are from the GarGeon × Sunway Big Box Mall waste and recycling report, Q2 2026, published with the client’s permission. Carbon figures are estimated from that tonnage using published conversion factors.
“For a 500,000 sq ft retail complex, … we can prove every load with the disposal record attached.”
More Malaysian operators put their results on the record.
Different industries, same contract — and each one can prove it.

Requests answered within 24 hours, with proof

Packaging waste turned into a rebate