Recycling Optimisation

Recycle more, and turn it into a rebate.

Track your recycling rate by site and stream. Catch contamination before a load gets rejected, and the rebate share lands back with you.

GarGeon Connect · KL · Selangor · Johor
Move the number

Your recycling rate becomes a number you can actually move.

See it by site and stream as loads happen, catch what drags it down, and act while it matters.

Contamination prevention

Stop contamination before it costs you.
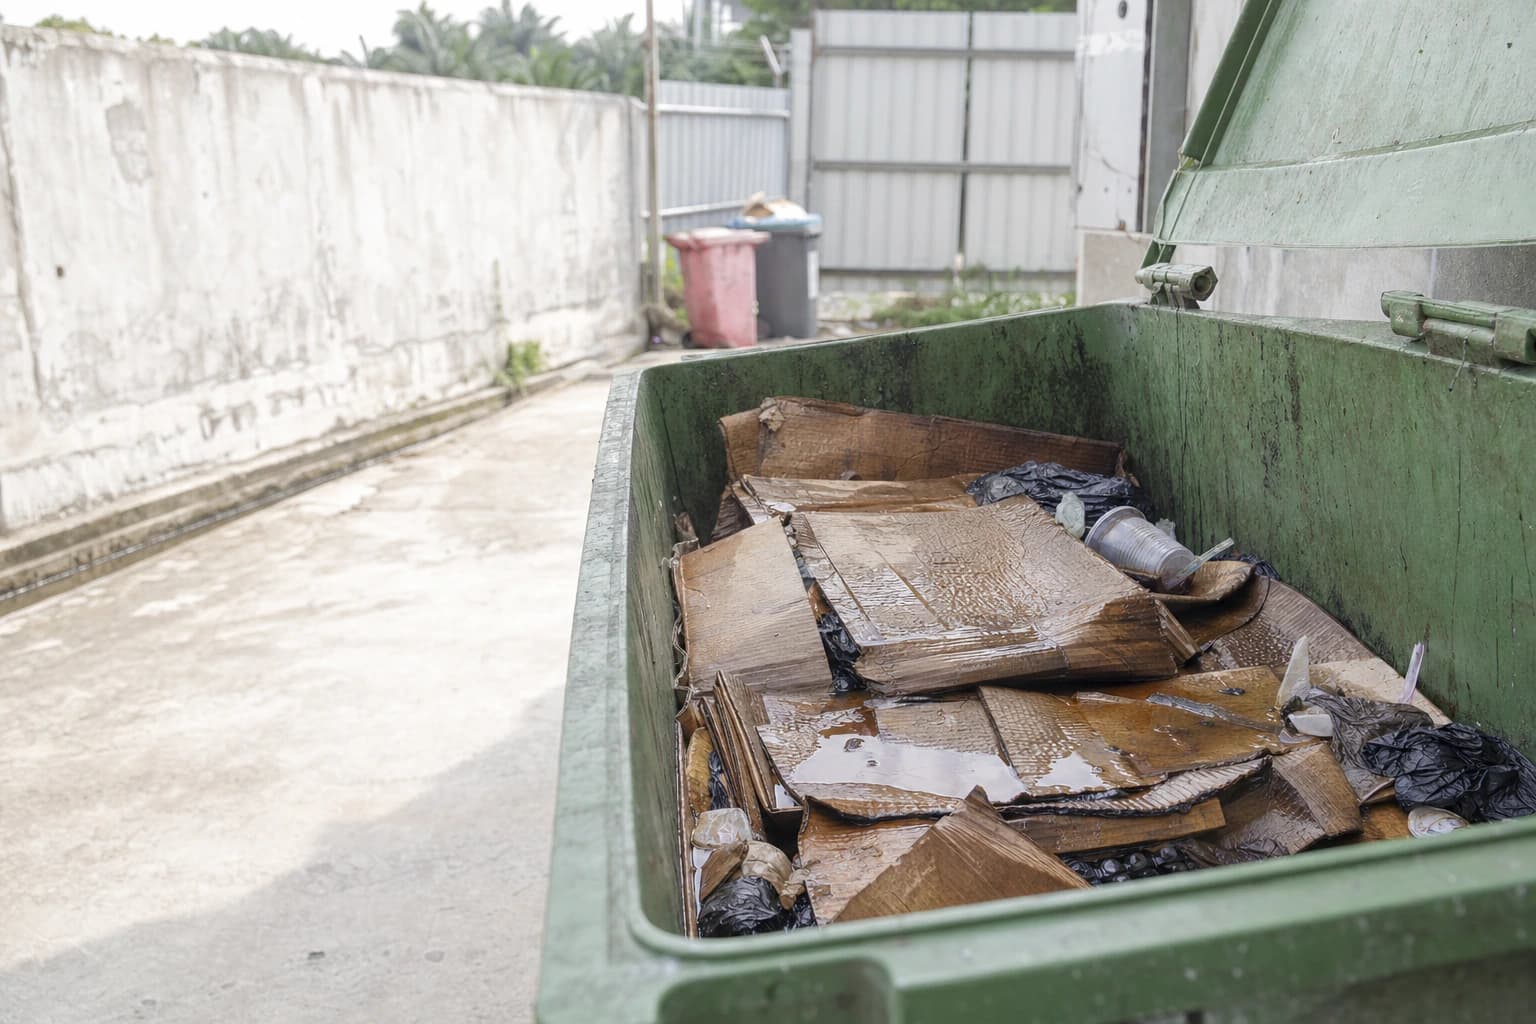
Photo-verified pickups make the wrong material visible before a whole load gets rejected. Fix the bin before the penalty hits your invoice.
Caught on the dashboardProtects the rebate
Representative contaminated load, cardboard spoiled by food waste and liquid
Diversion by site

See exactly where diversion stalls.

Diversion rate is broken down by site and stream. Open one site, fix the bins that matter most, and track the result.
By site and streamFix the right bins
Multi-site enterprise facility with managed waste collection
Recovery, documented

Every diverted kilogram goes on the record.

Track what is recovered against what goes to landfill, with weighed loads behind every figure — tied to a rebate share through Recycle Solutions.
Weighed loadsRebate share, not a bill
Collection truck moving recovered material for recycling
From your quarterly reportReal client data · Q2 2026

When the rate slips, the report says so.

This is a real client quarter, published with permission. We show the sum, not just the percentage, so you can check it yourself — and what the recycling kept off your carbon footprint. When the number moves the wrong way, as it did here, it goes in the report with what we think you should look at.

How the recycling rate was worked out

1.31 t recycling ÷ (40.02 t waste + 1.31 t recycling) = 3.2% diverted from landfill.

What recycling kept off your carbon footprint

5.33 t recycled × (0.5206 − 0.0047) = 2.7 tCO2e kept off the quarter’s footprint.

Recycling fell every month

Volume dropped from 2.40 t to 1.31 t, and the rate from 6.7% to 3.2% — a quarter average of 4.6%, well below the 20% and more that malls commonly reach. April had both carton and metal; May and June were carton only. Recycling still kept 2.7 tCO2e off the quarter’s footprint, but that figure shrank each month too.

What we recommend you check

Waste is rising while recycling falls, so check whether cardboard and metal are going into the general bins instead of the recycling chamber, and confirm the recent vendor change has not reduced recycling pickups. Both would lift the rate and lower the footprint.

Recycling rate
Share of everything collected that was recycled rather than landfilled.
View the chart data as a table
Every figure plotted above, April to June. Carbon figures are estimates.
MeasureAprilMayJune
Sent to landfill (t)33.5037.9940.02
Recycled (t)2.401.621.31
Recycling rate6.7%4.1%3.2%
Waste carbon footprint (tCO2e, est.)17.519.820.8
Kept off by recycling (tCO2e, est.)1.20.80.7
On-time collection81%93.2%95.3%

Tonnage, recycling and on-time figures are from a GarGeon quarterly waste and recycling report for a retail mall client, Q2 2026, published with the client’s permission. Carbon figures are estimated from that tonnage using published conversion factors.

Recovery, documented

Diversion you can measure and move.

7
materials that pay
via Recycle Solutions
100%
of loads weighed
behind every diversion figure
3
states covered
KL · Selangor · Johor
1
rate by site & stream
see where recovery rises or stalls
Common Questions

Common questions about raising recycling rates

How contamination gets caught, how diversion is tracked, and how recycling pays you back instead of billing you.

Talk to Our Team

Photo-verified pickups make the wrong material in a stream visible before a whole load gets rejected. A compromised bin surfaces on the dashboard, so you fix it and protect the rebate — instead of finding out when the penalty hits your invoice.

GarGeon Connect breaks your diversion rate down by site and stream as loads happen. You can open any location, see which bins are dragging the number down, fix the right ones, and track the result — with weighed loads behind every figure.

Recovered material earns a rebate share through Recycle Solutions instead of landing as a bill. More of your waste gets recycled, the diversion is documented, and the rebate share lands back with you.

Recycle Solutions recovers seven material streams across KL, Selangor, and Johor. We track what is recovered against what goes to landfill, by site and stream, so you can see exactly which materials are earning a rebate.

Ready to recycle more and earn the rebate?

One consultation maps your sites and streams, shows where diversion stalls, and ties recovery to a rebate share. Tell us your locations and current vendors.

Book a Consultation